
Special Edition: South Coast Economic Indicators - September
- Dec 1, 2025
- 2 min read
The U.S. Bureau of Labor Statistics suspended production of monthly employment and unemployment reports for the nation, states, and metropolitan areas as of Oct. 1, 2025. Other labor market information continues to be available on QualityInfo.org or by contacting your local economist. Our mission to provide accurate, reliable, and timely information about Oregon's state and local labor markets to inform our customers remains unchanged.
This month’s South Coast indicators with statewide Q3 Job Vacancy Survey results in place of updates to the unemployment rate and industry employment change over-the-year is also available at this link!
Oregon Job Vacancy Survey Results
Oregon businesses reported 53,600 vacancies in summer 2025. Vacancies increased 5% from the spring and decreased 12% from summer 2024. After reaching elevated levels of close to 100,000 job vacancies in spring 2021 through summer 2022 in the rapid hiring following pandemic re-openings, job vacancies across Oregon have returned to and stayed at pre-pandemic levels.
From an industry perspective health care and social assistance represented 23% of all summer vacancies with 12,542. Retail trade had 6,075 (11%) and construction had 6,047 (11%). Natural resources had the least with 585 (1%).
57% of Summer job vacancies were reported as difficult to fill. The occupations with the highest number of difficult-to-fill vacancies were:
Truck drivers
Retail salespersons
Personal care aides
Special Topic: Federal Government Employment & Wages
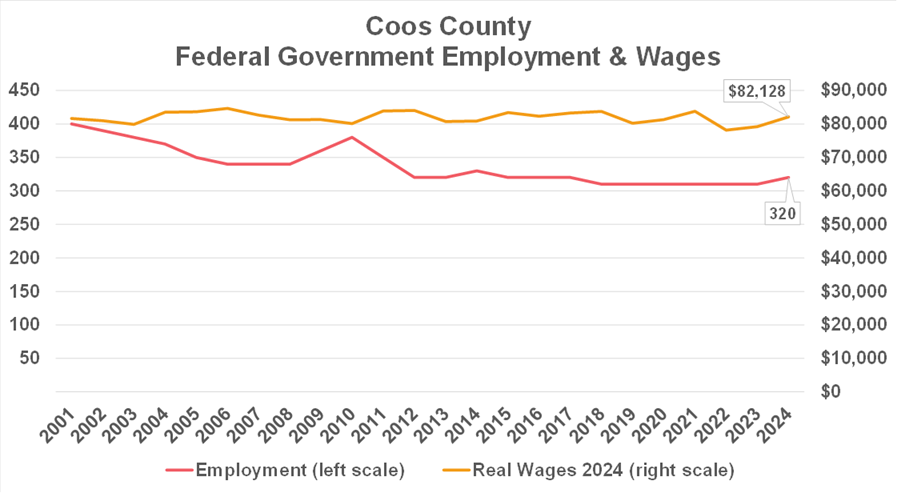
Federal government employment has been trending down over the past 23 years in Coos County. In 2024 the sector employed 80 fewer workers (-20%) compared with 2001. Current employment data won’t reflect those who took the buyout option and remain on payrolls until September. Those declines will show up in October estimates. While employment has decreased over this period, average wages have increased $523 (1%). Wages were $10,815 above the average annual wage in Oregon in 2024.

Federal government employment has been relatively stable over the past 23 years in Curry County. In 2024 the sector employed 30 fewer workers (-23%) compared with 2001. While employment has decreased over this period, average wages have increased $18,515 (28%). Wages were $12,804 above the average annual wage in Oregon in 2024.
Quality Reads on QualityInfo
Thanks for reading! Please contact me with any labor market or economic inquiries you may have. Your feedback and ideas for special topics are also welcome.
Jeff McAllister (he/him/his)
Workforce Analyst / Economist
Serving Coos, Curry, Josephine, Jackson, Klamath and Lake Counties
(541) 414-5325


Comments